After examining the audit samples, you have a conclusion about the samples. Now, you need to extrapolate the conclusion to the population. Can you directly infer the sample’s result? Is there any formula to follow? How to do extrapolation in Monetary Unit Sampling (MUS)?
A procedure to measure the characteristics of a population based on characteristics you found on the samples.
Say from the population of $77,827, you picked samples with a total value of $1,234. From those samples, you found an overstatement valued at $134; ergo, there are about 11% misstatements. You then apply the percentage for the population and conclude the population’s overstatement is $8,561.
That’s the sample extrapolation. You create a procedure to measure the population’s misstatement (a characteristic) from the sample’s overstatement characteristic.
But bear in mind that the previous method isn’t the right way to do Monetary Unit Sampling Extrapolation.
So, what’s the correct way to review the sample’s results on Monetary Unit Sampling?
First, you need to know about the error assignment methods.
When selecting samples from the population, you pick the logical unit (the balance or transaction or line item) pointed out by the Monetary Unit Sampling method of item selection. If any errors are detected within those chosen logical units, you’ll require a method to assign the error to the constituent monetary unit.

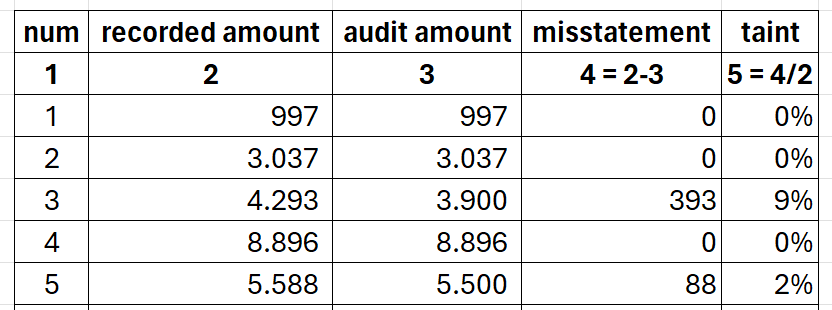
As you can see in the above table, an error occurs when the audit amount doesn’t agree with the recorded amount. The error is then divided by the recorded amount, that is, the taint value.
The All-or-nothing method (sometimes abbreviated as AON) sees each logical unit as a collection of monetary units, some of which are entirely correct and some of which are completely erroneous. You can assign the monetary unit in error at the beginning of the logical unit or at the last part. Usually, it’s on the earlier part.
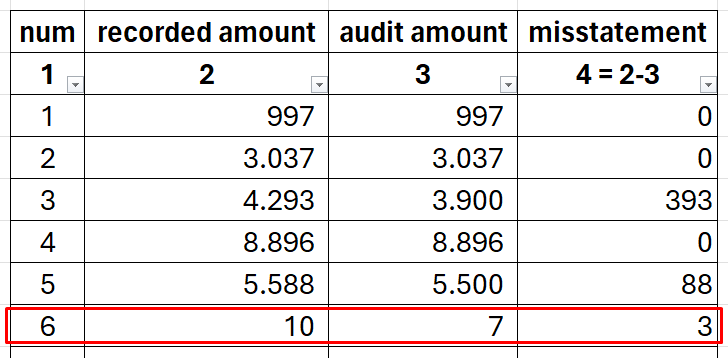
For example, on the sixth sample with a recorded amount of 10, you found a misstatement of 3. When using the AON method, the logical unit acts as a collection of monetary units consisting of ten monetary units. Each monetary unit is labeled as (entirely) correct or error.
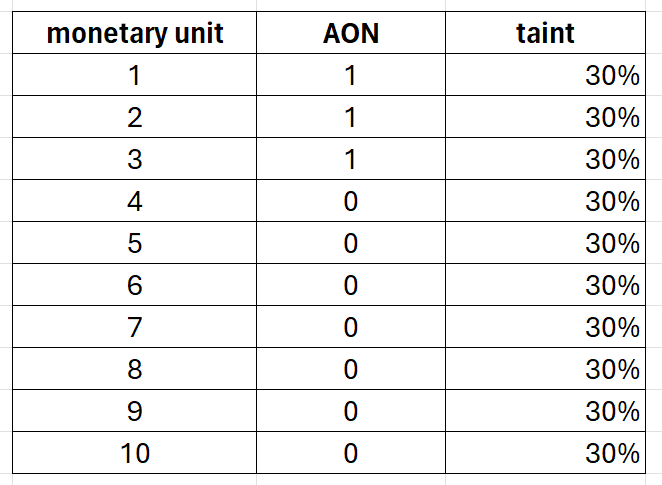
The above table shows the different approaches between the two methods. With the taint method, each monetary unit is attributed to the logical unit’s error. On the other hand, the AON method treats each monetary unit from the same logical unit differently.
Horgan’s study provided insights into the advantages and disadvantages of the taint and all-or-nothing methods. Here’s a quick resume.
| Advantage | Disadvantage |
| The method heightened the ability to detect small errors on the large logical units, resulting in enhanced detection sensitivity for small taintings. | The commonly employed bounds are heuristic in nature and lack rigorous mathematical justification. |
| Advantage | Disadvantage |
| Statistically reliable. | The calculation of a bound shows more variability when employing the AON method compared to the taint method. |
| The calculation of bound shows more variability when employing the AON method compared to the taint method. |
For the following section, you’ll use the taint method as the MUS error assignment method.
You’ll get a certain figure after reviewing the Monetary Unit Sampling results. Using the previous example, you get $8,561 as the population overstatement. But what must be done with the figure?
The answer is you should compare the population’s overstatement (the Upper Misstatement Limit) with the Tolerable Misstatement. Below are the conclusions and actions for each comparison’s results.
The findings from the sample support the conclusion that the population misstatement is within the acceptable limit, not exceeding the tolerable misstatement threshold. This usually is the auditor’s expectation of misstatement.
The sample findings do not provide sufficient evidence to conclude that the population’s misstatement is within the acceptable threshold. This outcome could occur due to higher rates and sizes of misstatements than what the auditor initially anticipated. Given the identified misstatements, It might also result from an insufficiently sized sample to achieve the desired confidence level.
When the Upper Misstatement Limit is greater than the Tolerable Misstatement, you may:
In short, if you want to extrapolate monetary unit sampling results, you’ll need to calculate the Upper Misstatement Limit. How to do it? The following figure summarizes the Upper Misstatement Limit formula for multiple audit scenarios you may face.
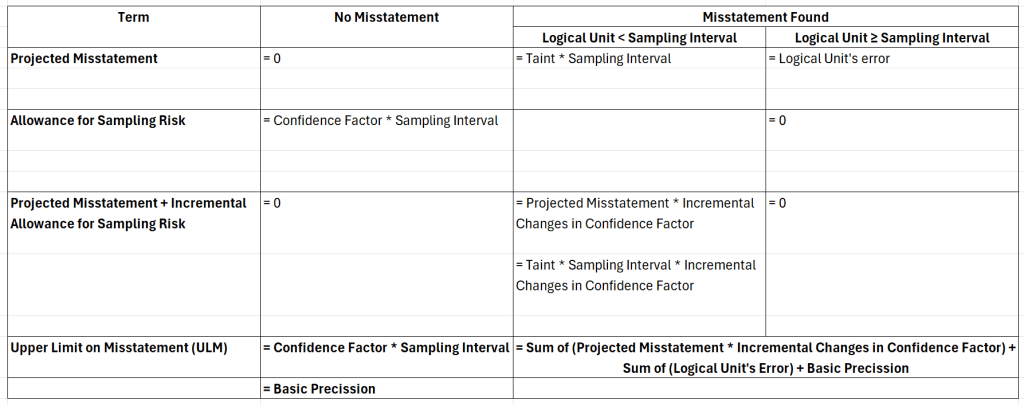
In essence, to calculate the Upper Misstatement Limit, you need to sum up three values: the sum of the projected misstatement, the sum of the logical unit’s error, and the basic precision. The combination of the three depends on the condition. You’ll delve into those three while elaborating on the audit scenarios.
If the logical unit is greater than the sampling interval, any misstatement you find on the logical unit, in this post, is called a “Logical Unit’s Error.”
The definition is used in this post only, so you may adjust a little when reading other sources.
At the heart of the Upper Misstatement Limit’s formula, you simply add projected misstatement with the allowance for sampling risk. Projected misstatement is the tainting percentage multiplying with the sampling interval. While the allowance for sampling risk results from multiplying the confidence factor with the sampling interval.
Upper Misstatement Limit = Projected Misstatement + Allowance for Sampling Risk
The projected misstatement is zero when you find no misstatement in the samples. So, you only need to calculate the Allowance for Sampling Risk by multiplying the Confidence Factor with the Sampling Interval.
Allowance for Sampling Risk = Confidence Factor * Sampling Interval
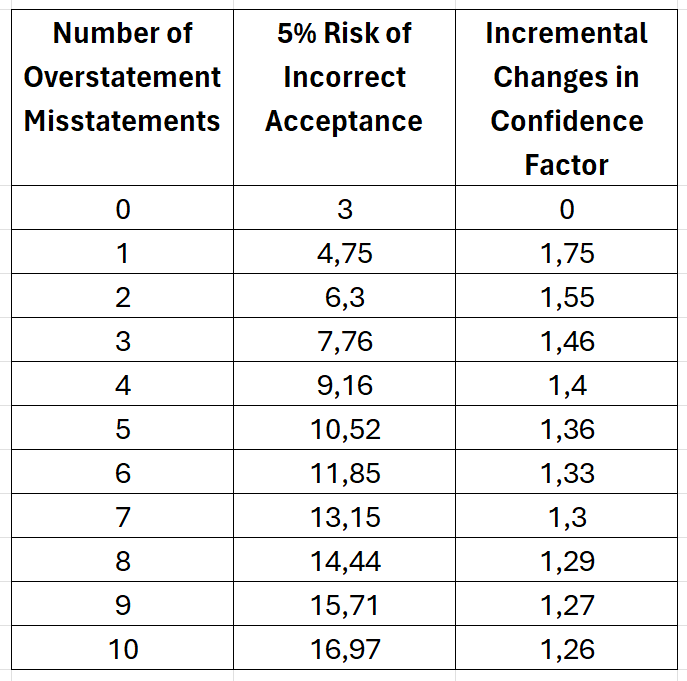
The confidence factor’s value depends on your choice of the risk of incorrect acceptance. The easiest way to get the confidence factor is through the AICPA’s Audit Sampling on the MUS Confidence Factor in Sample Evaluation (Table C-3). For example, if you chose a 5% risk of incorrect acceptance and found no misstatement (zero on the number of overstatement misstatements column) on the samples, the table will refer to 3,00 as the confidence factor.
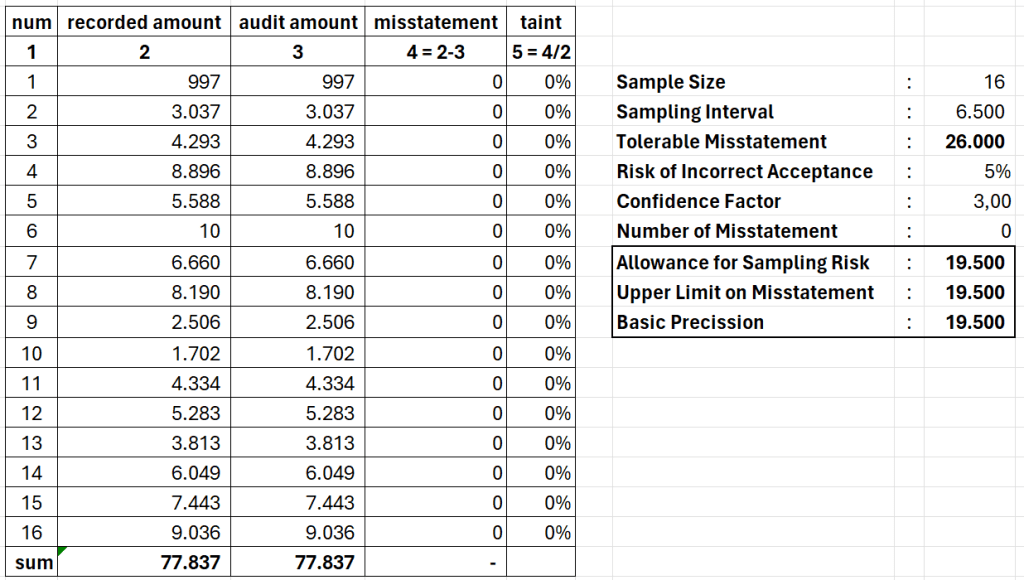
Using the previous table as an example, after plunging the number to the Allowance for Sampling Risk equation, you’ll get 19.500 (3,00 * 6.500). And, as previously stated, when no misstatement is found, the Upper Misstatement Limit value is the same as the Allowance for Sampling Risk value, 19.500, in this example.
The UML value, obviously, doesn’t exceed the Tolerable Misstatement value. So, you conclude the population misstatement is within the acceptable limit.
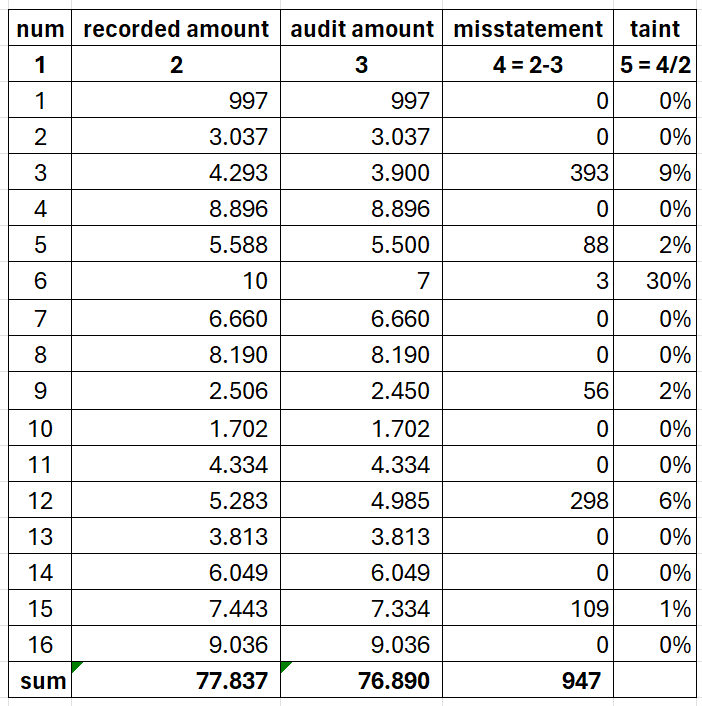
Consider the previous table as your sampling results. From 16 samples, you found six logical units with overstatement on them. As a note, you’ve decided the tolerable misstatement as 26.000, the risk of incorrect acceptance is 5%, and 6.500 is the sampling interval.

Those six overstated logical units consist of five with values less than the sampling interval and one logical unit that has a greater value than the sampling interval. Each category has a different method to calculate the “projected misstatement and allowance for sampling risk” part, but in the end, you’ll sum up both categories’ results and add them with basic precision.
Upper Limit on Misstatement = Sum of (Less than Sampling Interval Results) + Sum of (Equal to or Greater than Sampling Interval Results) + Basic Precission

The projected misstatement results from the taint percentage multiplied by the sampling interval for the logical units with values less than the sampling interval.
Projected Misstatement = Taint Percentage * Sampling Interval
Next, arrange the projected misstatements, with the larger ones coming first.
To get the incremental changes in the confidence factor, again, consult the AICPA’s Table C-3. Grab the confidence factor, as referred to, your risk of incorrect acceptance, and compute the incremental changes.
The last step is calculating the projected misstatement plus incremental allowance for sampling risk by multiplying the incremental changes with the projected misstatement.
Projected Misstatement + Incremental Allowance for Sampling Risk = Incremental Changes in Confidence Factor * Projected Misstatement
In this case, 5.213 is the sum of projected misstatement plus incremental allowance for sampling risk. Since there is a sample with a logical unit value larger than the sampling interval, you need to calculate it first before adding it with the basic precision.
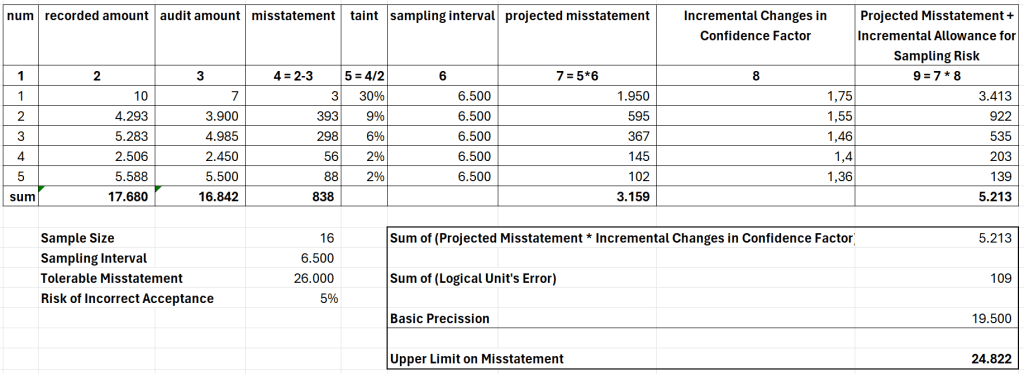
The Tolerable Misstatement is 26.000, meaning the Upper Limit on Misstatement is still below it. Thus, the conclusion is the population is not misstated by more than tolerable misstatement at the 5% risk of incorrect acceptance.
Good for the client (and you, too).
Subtract the recorded amount with the audit amount. Then, divide the result with the recorded amount.
What is the Allowance for Sampling Risk?The amount that auditors are willing to allow for the possibility that their sample might not correctly represent the entire population. It’s the same as the precision in statistical sampling terms.
How do you calculate the Allowance for Sampling Risk?Multiply the Confidence Factor with the Sampling Interval.
How do you calculate the sampling interval?Divide the population by sample size.
How do you calculate projected misstatement?Multiply the tainting percentage with the Sampling Interval.
How do you calculate projected misstatement if the logical unit’s value equals or exceeds the sampling interval?
Use the logical unit’s overstatement plus basic precision.
What is the Risk of Incorrect Acceptance?A risk in which audit sample results incorrectly support the conclusion that an account balance is accurate/not materially misstated, even though it’s materially misstated.
What is the Basic PrecisionThe upper misstatement limit value when no misstatement is found by the auditor.
What is the Upper Misstatement Limit?The maximum overstatement that potentially exists in a population, considering the sample errors found by the auditor.
How to do Monetary Unit Sampling Extrapolation?Calculate the Upper Misstatement Limit. To get the Upper Misstatement Limit, you need to add three variables: 1) the projected misstatement, 2) the logical unit’s error, and 3) the basic precision.
The Upper Misstatement Limit, also known asUpper Limit on Mistatement, Upper Error Limit, Misstatement Bound, Misstatement upper limit.
Cover Images generated by Canva’s Text to Image App.